tl;dr
Basically, AREDS clinical trial grading data was found to be flip-floping for our analysis purposes. We defined a certain criteria for our research that is unique but could cause confusion due to the complexity of the formula or uncommon technique in this dataset.
- To address this, I created a simple visualization to help explain the flip-flop issue, and the result using our novel code.
- Another good thing about this visualization is that, the code to make this graph can easily & quickly be modified depending if reviewers/leaders want to see a different version.
The original visualization was created using R + ggplot2.
BACKGROUND STORY
AREDS 1 overview
AREDS was a multiyear longitudinal clinical trial on age-related macular degeneration, looking to see the effect of supplements on the progression of the disease. During the first AREDS trial, the grading system utilized 9 steps plus progression to the advanced AMD.
Many papers have been published and explained the trial design and results. So I won’t go into details here.
–
Research Objective
While many studies now used the simplified scale, we used the full scale to create a more granular analysis on the time-based progression of the disease.
Severity scale 1-8: was for the non-advanced AMD grade.
Severity scale 9: was for the advanced AMD grade.
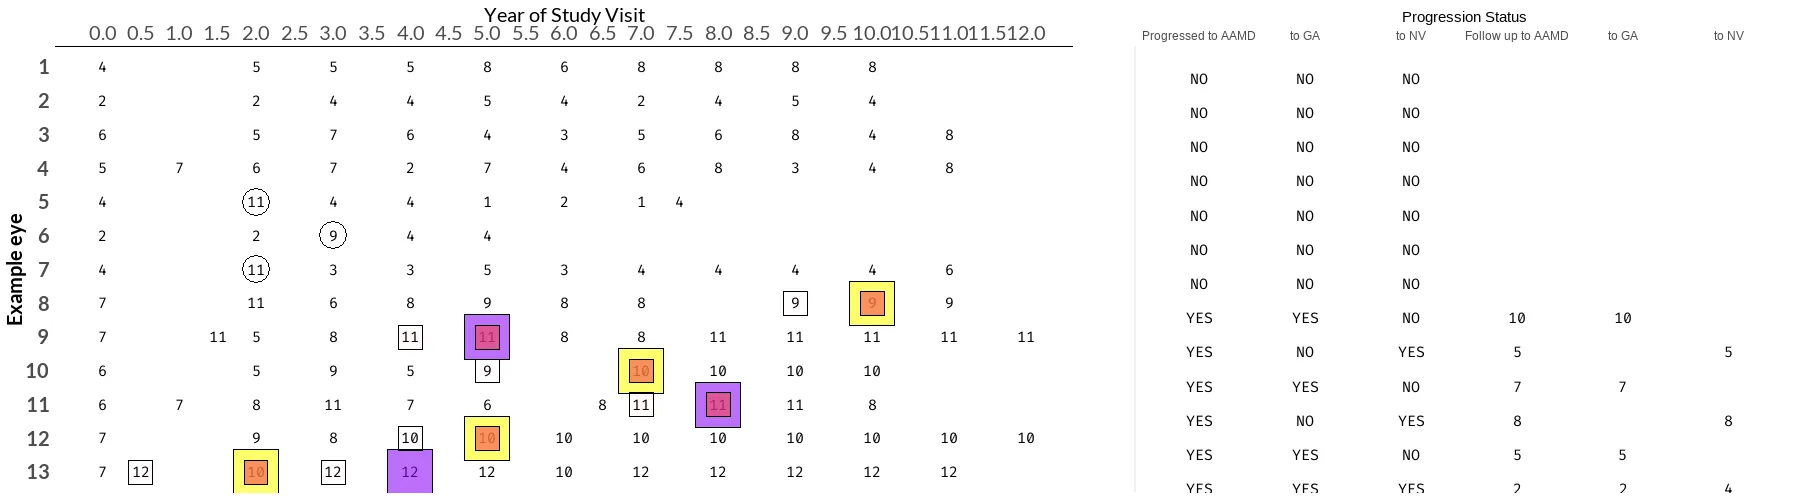
modified severity scale 9, to include 10, 11, 12: was our modification to include GA and NV as part of the continuous scale.
–
Story
Since we analyzed it in very granular level, we hit an issue where the count of advanced AMD was different between timepoints.
Upon further investigation, we found that there were many cases where an eye was graded as progressed to advanced stage but then went back to non-advanced stage.
Since we wanted to analyze this progression like survival analysis, we had to make sure that a progressed eye should not go back to non-advanced stage.
- In some cases, the advanced grade only occured once in the middle of the study period and then back to very early stage (scale <6).
- In other cases, the time when the eye progressed to advanced stage occurred multiple times.
So, we developed a criteria to only select the eye as progressed eye, when the grade or status had passed the progression status/scale, at least at 2 time points in a sequence.
Then we realized the system was quite abstract.
- So, I developed a visualization to show the progression and the flip flopping issue.
–
GRAPH PREVIEW
Understanding the graph:
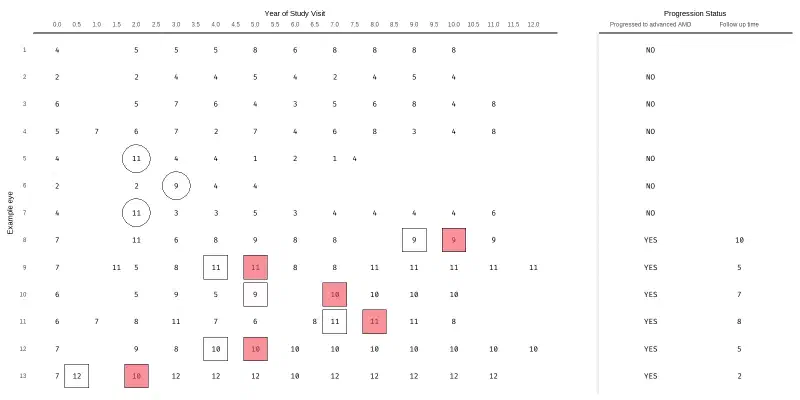
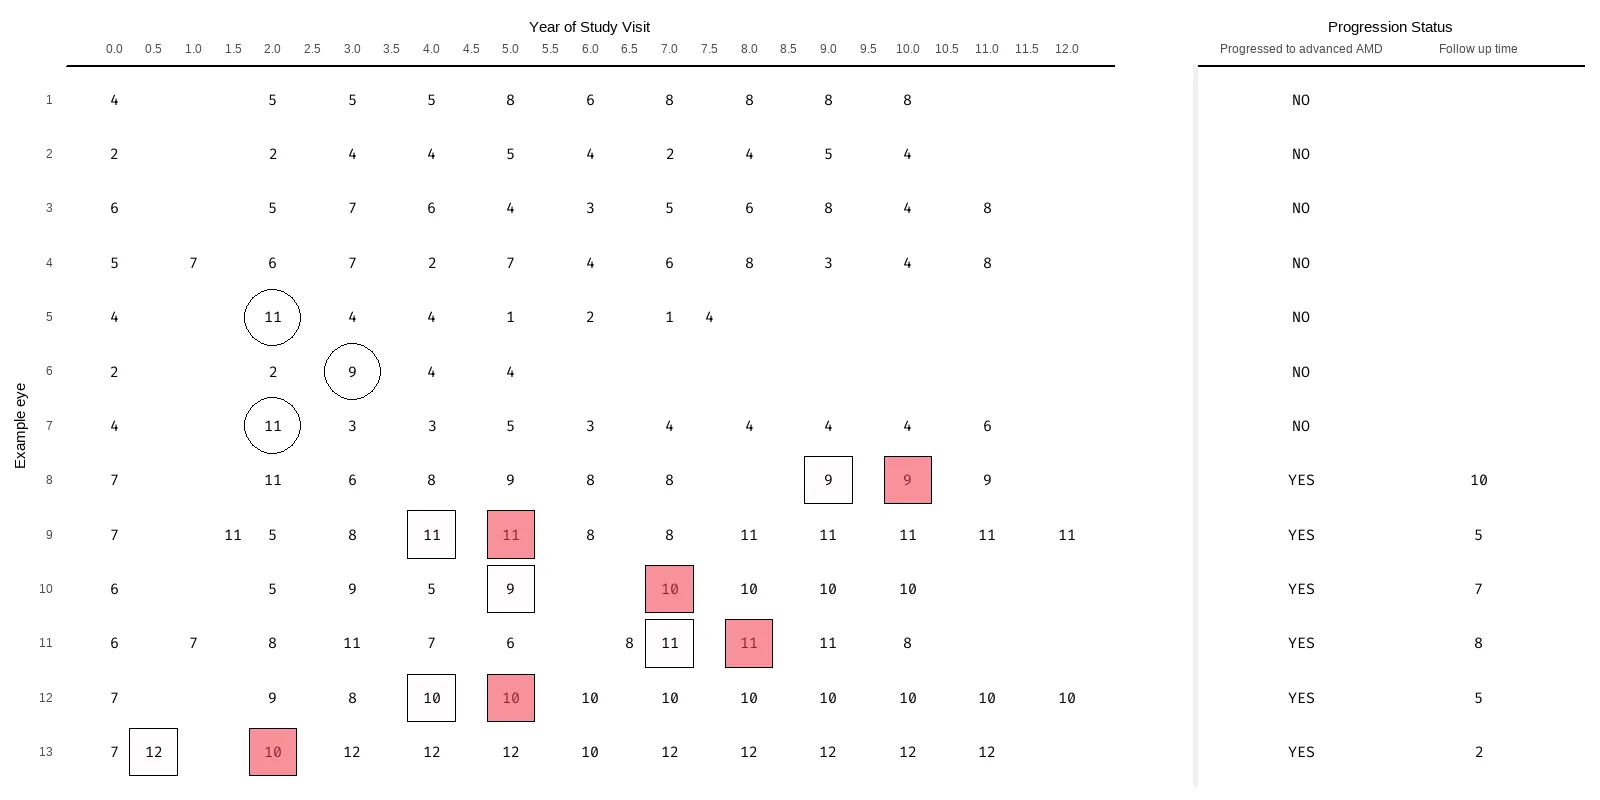
The graph shows the typical grading for the subjects in AREDS 1 trial.
- The usual grade was taken after baseline visit was within 2 years.
- Different subjects had different total follow-up time.
The main issue is represented on ID 5, 6, and 7 (eye ID, not the same as the AREDS ID, the replacement is just for better visualization).
- Eye went to advanced stage on 2nd grading (scale 11), but went back to low (scale 4) on the 3rd visit. It even reached healthy status (scale 1) on the 5th visit.
- We decided that on these cases, the progression could be due to some human errors or study design error (blinded graders).
- These cases were the reason we developed a different criteria in defining when an eye was progressed to advanced stage.
The next few cases are representing how we selected the time of the progression.
- Eye 11 is a good example on how we skip the first progression (scale 11) as the following grades were back to non-advanced stage.
- When the eye finally had advanced stage grade back to back, we defined that this was a true progression.
- But instead of selecting the first grade, we chose the second timepoint for the true termination point.
Other version
CONCLUSION
Snippet for the R code is in my github.
The code originally was developed for our internal meeting where we wanted to view and compare individual ID/grades when we came across some issues. So, it was originally created so that we could quickly review each id and the code has more features such as multiple progression criteria.
We simplified the visualization a bit for the publication purpose.
CITATION
Seddon JM, Widjajahakim R, Rosner B. Rare and Common Genetic Variants, Smoking, and Body Mass Index: Progression and Earlier Age of Developing Advanced Age-Related Macular Degeneration. Invest Ophthalmol Vis Sci. 2020;61(14):32. doi:10.1167/iovs.61.14.32